Chemical Agent Classification and Concentration Estimation
CAC-CETTM is a new software tool that can classify and estimate concentrations of different chemical agents. The tool is modular, flexible, and suitable for real-time chemical agent classification applications, including conventional and nano-sensors. It is low cost and independent of commercial software packages such as Matlab, Labview, etc.
Video Demos
1. Gas Classification of Single Chemicals:
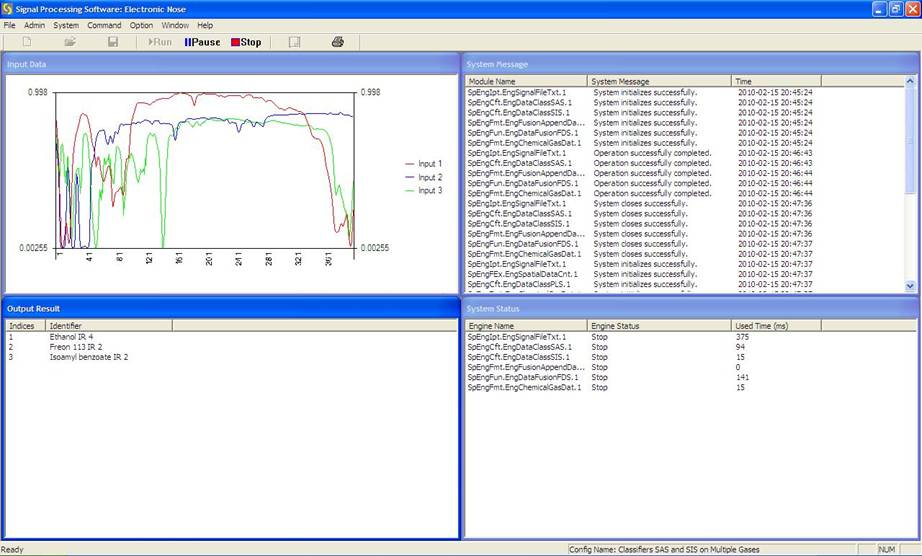
The inputs to our tool are nano-sensor outputs. The data files are saved in a folder. Our tool reads each dataset, processes it, classifies the chemical, and displays the agent label on the screen. Each dataset contains a single agent. The top left of the GUI shows the input data; lower left shows the classification results; right top shows the system messages; the lower right shows the processing time of each module. It can be seen that the classification results are correct and the processing time is about 1.5 seconds.
2. Gas Classification and Concentration Estimation of Multiple Chemicals:
The inputs to our tool are nano-sensor outputs. The following video clip shows a demonstration of the processing of nano-sensor data containing 3 molecules of type A, 5 molecules of type B, and 6 molecules of type C. One can see that it is feasible to use a single nanosensor to classify and estimate concentrations of multiple chemicals in a mixture. The estimated concentration reflects the relative percentage ratios of the different gases. For example, gas A has a concentration of 0.205715, which is very close to 3/14 (0.2142); gas B has a concentration of 0.359538, which is very close to 5/14 (0.357).
3. Unmixing of Multiple Chemicals Using Spectral Information:
The inputs are spectra from Fourier transform infrared spectroscopy (FTIR) sensors. Data were collected by NIST. The top left subwindow shows the spectrum of the input data. The lower left shows the classification results. Here we assume that the chemicals in the mixture may come from 10 chemicals. In the past, we have done simulations in which the chemical library has more than 200 chemicals. It can be seen that the chemicals in mixtures have been correctly identified and their respective concentrations have been correctly estimated. The processing is also very fast, less than 0.1 seconds.
4. Chemical classification Using Taguchi Sensor:
A commercial Taguchi sensor was used to collect data. Three vapors, hydrogen, ethanol, and air were used. The sensor outputs are shown in the upper left sub-window. The classified results are displayed in the lower left. For each class, the relative concentration is displayed. For example, when we fed a data file containing air measurements using Taguchi, the estimation results show that air has 0.8907, ethanol has 0.10 and hydrogen has 0.0022. This shows that air is dominant over the over types. Similarly, when we fed a dataset containing only ethanol into our tool, the estimation results show that ethanol has 1.00 and others have 0. Here the processing time is also very fast, less than 0.5 seconds.
Software Screenshot
Applications:Security

